$40B Below 80 - A Credit Analyst's Framework for AI Disruption in Software
E8 — Alec Keblish & Matthew Hughes (9fin) map the $40B software loan sell-off — leverage mechanics, margin compression, and a credit framework for AI exposed SaaS names

For a decade, software was the preferred leveraged buyout vehicle in credit markets: contracted recurring revenue, 80%-plus gross margins, and a debt service profile that could support 7–10x EBITDA leverage. Artificial intelligence was supposed to reinforce that thesis. It is doing the opposite — and the mechanism is more structurally damaging than most credit models anticipated. Forty billion dollars of software loans are now trading below 80 cents on the dollar, up from $25 billion just thirty days ago. But the more important number is not in any price feed: it is the non-linear mathematics of what even a modest margin compression does to a business levered at 7x — and which software credits are structurally exposed versus which ones AI actually makes stronger.
Alec Keblish and Matthew Hughes, both senior analysts at 9fin joined Fixed + Floating to work through the mechanics systematically.
The Foundation: What Made Software the Ideal LBO Candidate
To understand why the current repricing is structurally significant, it helps to recall why software attracted more than $500 billion of leveraged debt in the first place.
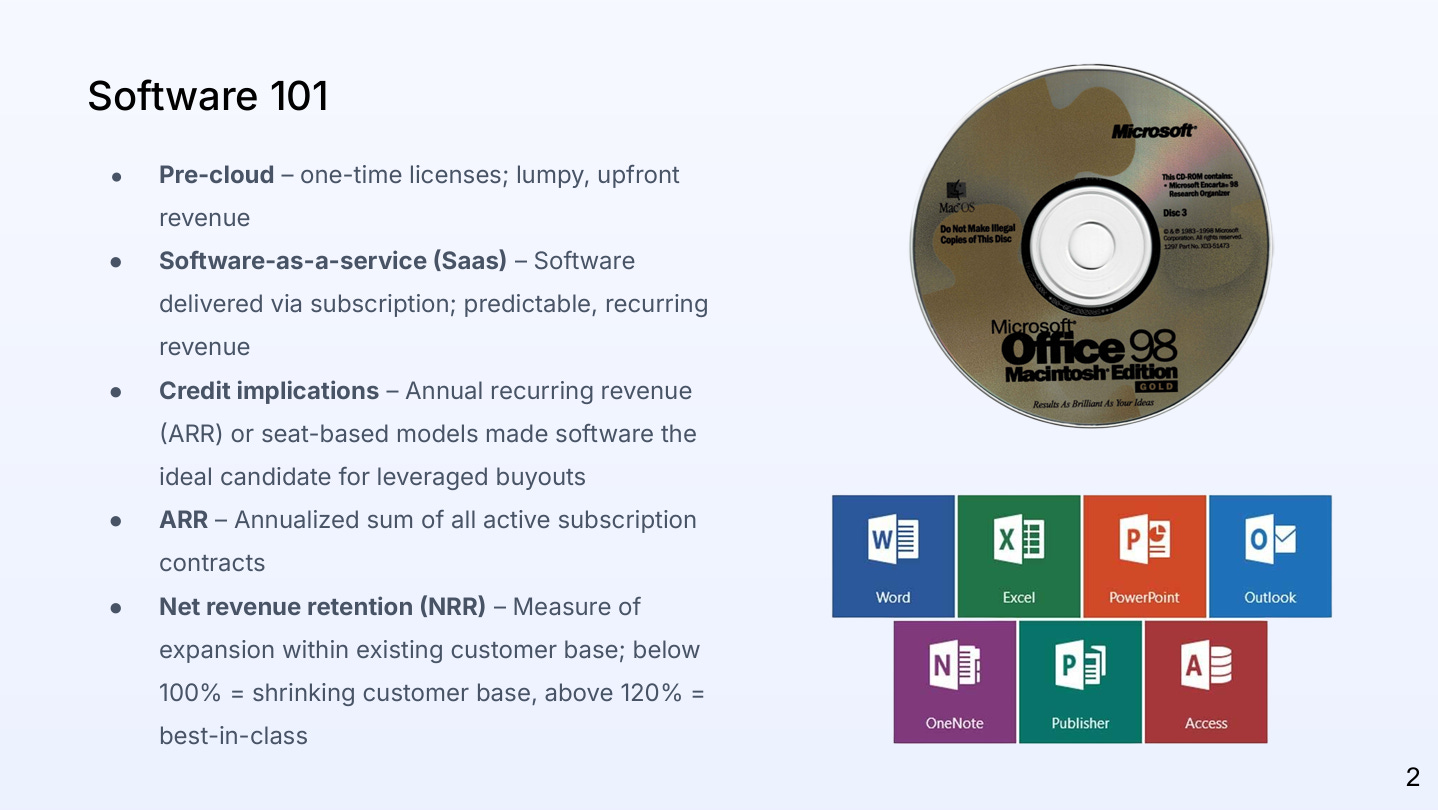
Pre-cloud, software was a physical product — a CD, a perpetual licence, a one-time payment. The shift to Software-as-a-Service flipped the cash flow profile entirely. Instead of volatile, lumpy revenue, SaaS companies generate annual recurring revenue (ARR): the annualised sum of all active subscription contracts, typically built annually in advance, often with auto-renewal clauses. The result is a business whose revenue is contracted, predictable, and aligned almost perfectly with debt service requirements.
Net revenue retention (NRR) — the metric that captures what is happening inside the existing customer base — became the secondary heartbeat metric. An NRR above 120% means the company grows organically without acquiring a single new customer (upsells and seat expansions outpace churn). A median SaaS business runs at 105–110%. Below 100% means the base is contracting before new logo growth is even considered. As a reference point from the European high yield market, TeamSystem — the Italian SME software provider — recently reported approximately 85% recurring revenue and an NRR of roughly 108%.
Gross retention of above 90%, combined with ARR predictability, is what lenders have historically underwritten. The stickiness comes from switching costs: data migration, staff retraining, workflow disruption, and contract inertia that make changing platforms a 6–18 month, multi-million-dollar process. For a credit investor, these dynamics translated into an asset-light business with 80%+ gross margins, near-zero marginal cost of serving incremental users, and a free cash flow conversion profile that justified leverage levels of 7–10x EBITDA — well above what most industrial or energy businesses could support.
The SaaS P&L: Where the Margin Structure Was Built
The margin structure that private equity built its software playbook on has a specific architecture. Walking through each line clarifies exactly where AI is now applying pressure.
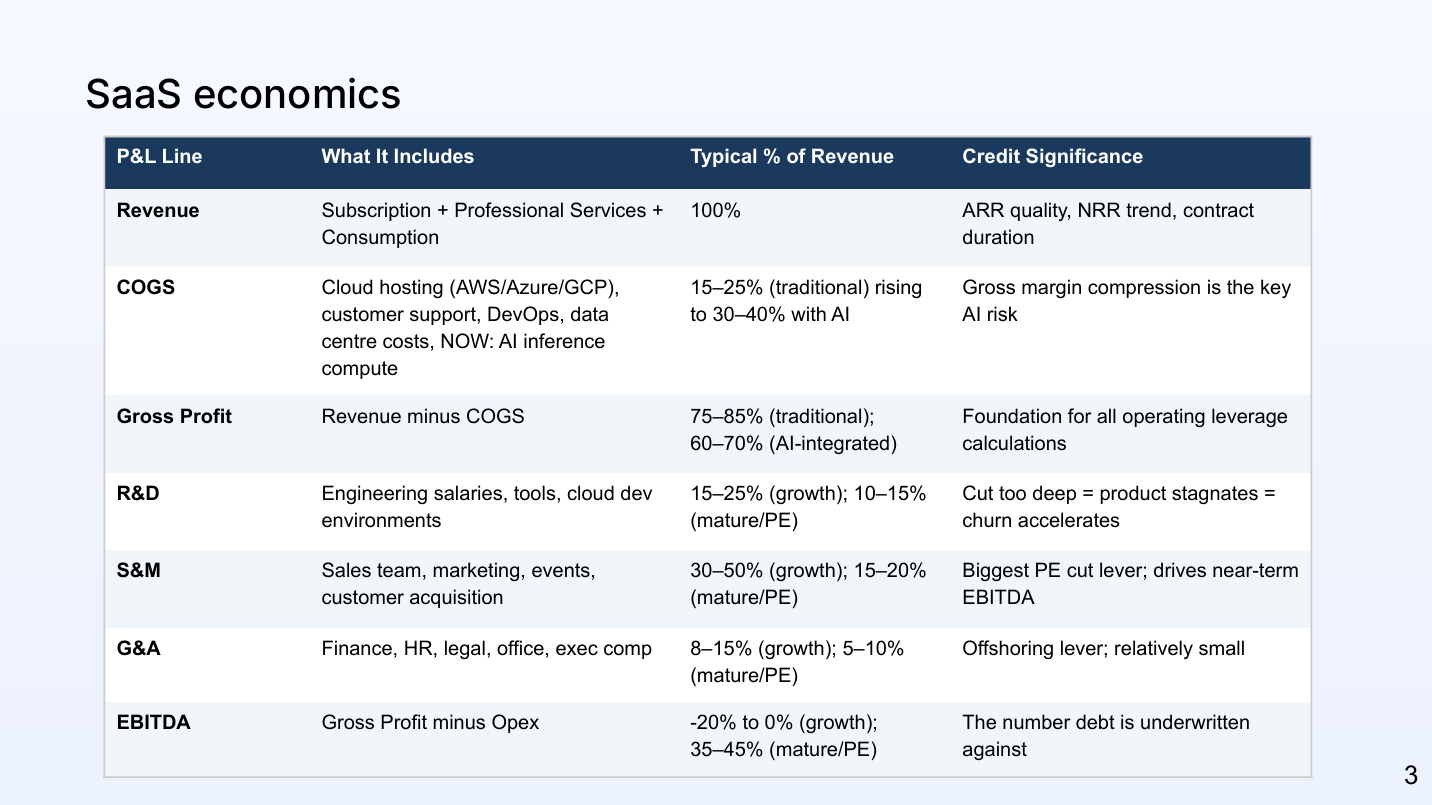
Revenue is primarily subscription ARR — contracted, recurring, typically billed annually in advance — supplemented in some cases by professional services at implementation, and increasingly by consumption-based elements tied to AI usage.
Cost of goods sold (COGS) has historically been 15–25% of revenue for traditional SaaS, covering cloud hosting (AWS, Azure, GCP), customer support, DevOps, and data centre costs. This is where AI introduces the most significant structural change: inference compute is now a new COGS line item, directly variable with usage. Every AI interaction — every model call — consumes GPU time, memory, and power. The more customers use the AI-enabled features, the higher COGS becomes. For AI-heavy models, COGS can rise to 30–40% of revenue.
The consequence is gross margin compression. Traditional SaaS gross margins run 75–85%. AI-integrated SaaS is compressing that range to 60–75%. For some agentic use cases with uncapped token consumption, gross margins can fall further. This matters because gross profit is the foundation of all operating leverage calculations — it is the engine that funds R&D, sales, and G&A while generating the EBITDA that debt is serviced against.
R&D — engineering salaries, development tools, cloud dev environments — typically runs 15–25% for growth-stage companies and 10–15% for mature or PE-owned names. The temptation post-acquisition is to cut here aggressively. The risk is product stagnation: underinvestment in R&D drives up churn, which is a slow-burn credit problem that shows up in NRR before it shows up in revenue. AI coding assistants are reporting 20–40% productivity gains, and some companies claim multiples of output per engineer — which theoretically allows R&D cost reduction without stagnation. But the same tools are available to every competitor, so productivity gains may simply get competed away through pricing pressure.
Sales and marketing is the largest lever PE firms pull post-acquisition. A growing SaaS company spends 30–50% of revenue here to acquire new logos. A mature or PE-owned company cuts that to 15–20%, relying on renewals and price hikes rather than new customer acquisition — a deliberate shift in strategy that compresses near-term EBITDA while accepting slower growth.
General and administrative (finance, HR, legal, executive comp) runs 8–15% for growth companies and 5–10% for mature names. Offshoring is the primary lever here, but G&A is a smaller portion of the cost base than R&D or S&M, so the impact is correspondingly limited.
The PE playbook is to acquire a company that spends 40–50% on S&M and 20–25% on R&D, cut both aggressively (to 15–20% and 10–15% respectively), push gross margins to 80–85% through hosting optimisation and pricing discipline, and exit with a 35–45% EBITDA margin against which 7–10x debt was underwritten. As Matthew noted: “Achieving 40% EBITDA with 85% gross margins requires a very specific profile. You can’t have 30–50% sales and marketing expense and hit 40% EBITDA. To get there, you must radically alter the operating expense structure.”
The Leverage Math: Why Margin Compression Is Non-Linear
This is the section that matters most for credit investors reviewing software names right now, because the leverage impact of margin compression is not proportional — it accelerates.
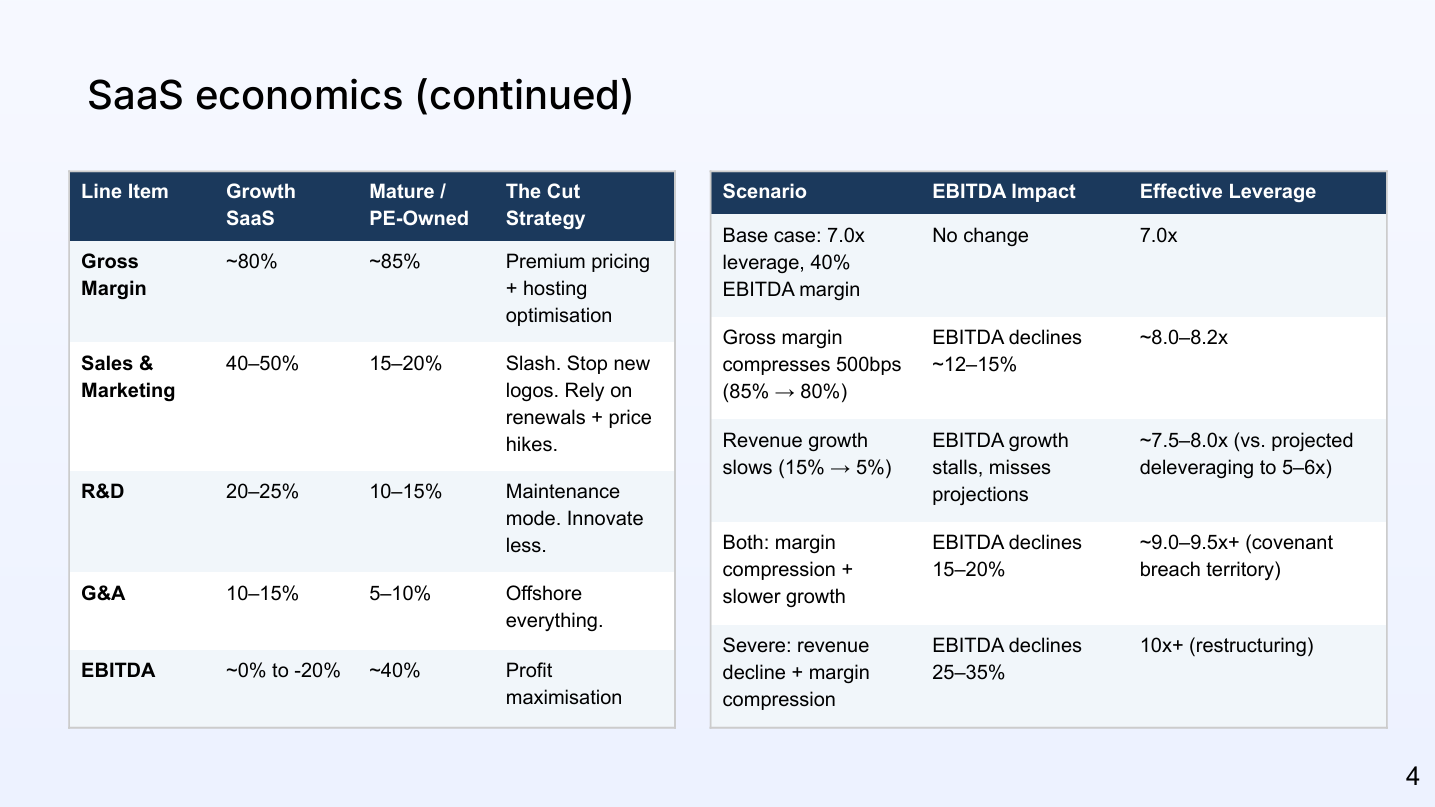
Start with a baseline: a 7x levered SaaS company running 40% EBITDA margins. If gross margins compress by 500 basis points — from 85% to 80% — EBITDA declines by approximately 12–15%. The natural assumption is that leverage ticks up by a proportional amount. It does not.
A 10% EBITDA decline does not move leverage from 7x to 7.7x. It moves it to 7.8x. A 20% EBITDA decline — the kind of pressure a company faces when gross margin compression is combined with revenue growth slowing from 15% to 5% — moves leverage to 8.75x. Add a revenue decline scenario and you are looking at 9–9.5x, which makes the capital structure hardly sustainable. A severe scenario — meaningful revenue contraction combined with gross margin compression — produces effective leverage of 10x or above, which is restructuring territory.
The dynamics around LTV compound the problem. Software multiples that once cleared 15–20x EBITDA at entry are compressing toward 10–12x in private markets — and if AI disruption continues, 8–10x exit multiples are not unrealistic. A 7x levered company bought at a 15x multiple has roughly a 5x turn of enterprise value cushion. At an 8x exit multiple, that cushion narrows to 1–3 turns of leverage — a thin margin for error for a business whose cash flow profile is being simultaneously pressured.
Recovery rates follow the same logic. Software credits have historically recovered 40–50 cents on the dollar — above the HY average — because of ARR stickiness and customer retention. But software assets are intangible: take the business and shake it upside down and what falls out is talented engineers, a maintained code base, and a contracted ARR base. Under distress, engineers leave first (they are highly employable), which drives quality slips, which accelerates churn, which drives further revenue decay. The doom loop is self-reinforcing and, once started, difficult to reverse.
AI as a New Cost of Goods Sold
The structural paradox of AI integration is that it is simultaneously mandatory and margin-destructive.
Traditional SaaS has near-zero marginal cost of serving additional users. Once the platform is built, incremental revenue is almost pure gross profit. This is the operating leverage that justifies high multiples. AI flips that dynamic: every AI interaction consumes compute resources, which means gross margins become directly correlated with usage. The more customers use the AI-enabled product, the higher COGS become — an inverse relationship between product performance and profitability.
The strategic dilemma, as Alec framed it, is explicit: “You have to integrate AI because it’s mandatory to be competitive. But doing so does structurally weaken the very margin profile that these companies were underwritten on.” A company that refuses to integrate AI loses customers to AI-native competitors. A company that does integrate AI erodes the gross margins that service its debt. There is no cost-free option.
On the productivity side, AI does offer genuine savings — primarily in engineering and customer support. AI coding assistants reduce developer headcount requirements; AI agents handle tier-one support tickets, reducing customer service cost. The bull case for incumbents is that AI-driven headcount reduction of 20–30% expands EBITDA margins enough to offset inference cost growth. The caveat is that since these productivity tools are universally accessible, any efficiency gains may simply get competed away through pricing pressure rather than dropping to the bottom line.
Fast-Growing vs. PE-Owned SaaS: Two Different Risk Profiles
The AI credit risk is materially different depending on which type of SaaS company you are looking at.
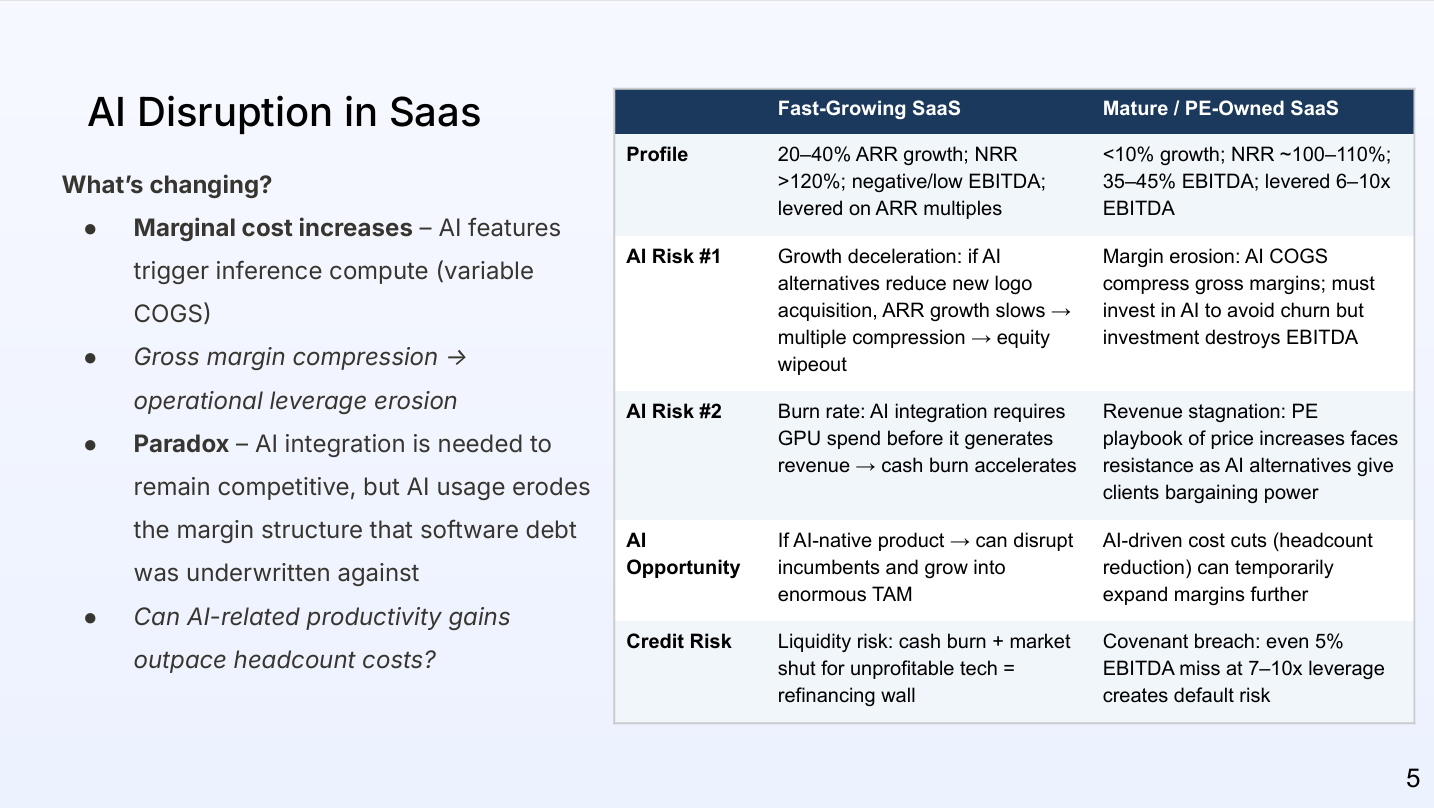
Fast-growing SaaS — 20–40% ARR growth, NRR above 120%, negative or low EBITDA, levered on ARR multiples — faces primarily a growth deceleration risk. AI alternatives make it harder to win new logos. If ARR growth slows, revenue multiples compress, and the equity cushion that justified aggressive leverage disappears. A secondary risk is liquidity: GPU infrastructure spend must be committed before AI features generate revenue, accelerating cash burn for companies that do not yet have the balance sheet to absorb it.
Mature / PE-owned SaaS — sub-10% growth, NRR around 100–110%, 35–45% EBITDA, levered 6–10x on EBITDA — faces primarily a margin erosion risk. These companies must invest in AI to defend their product against disruptors, but every dollar of AI investment directly compresses the EBITDA margins that their debt covenants are tested against. The PE playbook of price hikes and cost cuts runs into a headwind: AI alternatives give enterprise clients new leverage in contract renewals. KPMG recently demonstrated this at an industry level — demanding and receiving a 14% fee reduction from its longtime auditor, citing AI productivity gains. That dynamic scales to enterprise software contracts.
The covenant risk is real: even a 5% EBITDA miss at 7–10x leverage creates default risk. Companies that fail to hit growth targets also fail to hit deleveraging targets, which for the most highly levered names was the central promise underwriting the refinancing.
Lessons from History: Technology Creates Value, Not Necessarily Returns
Alistair Nairn’s Engines That Move Markets — a book I can highly recommend (apart from the 2000s the part about autos is great as well) — studies every major technology transition from railways to the internet and surfaces a lesson that is structurally relevant right now: identifying which industries will be disrupted is substantially easier than identifying which companies will win.
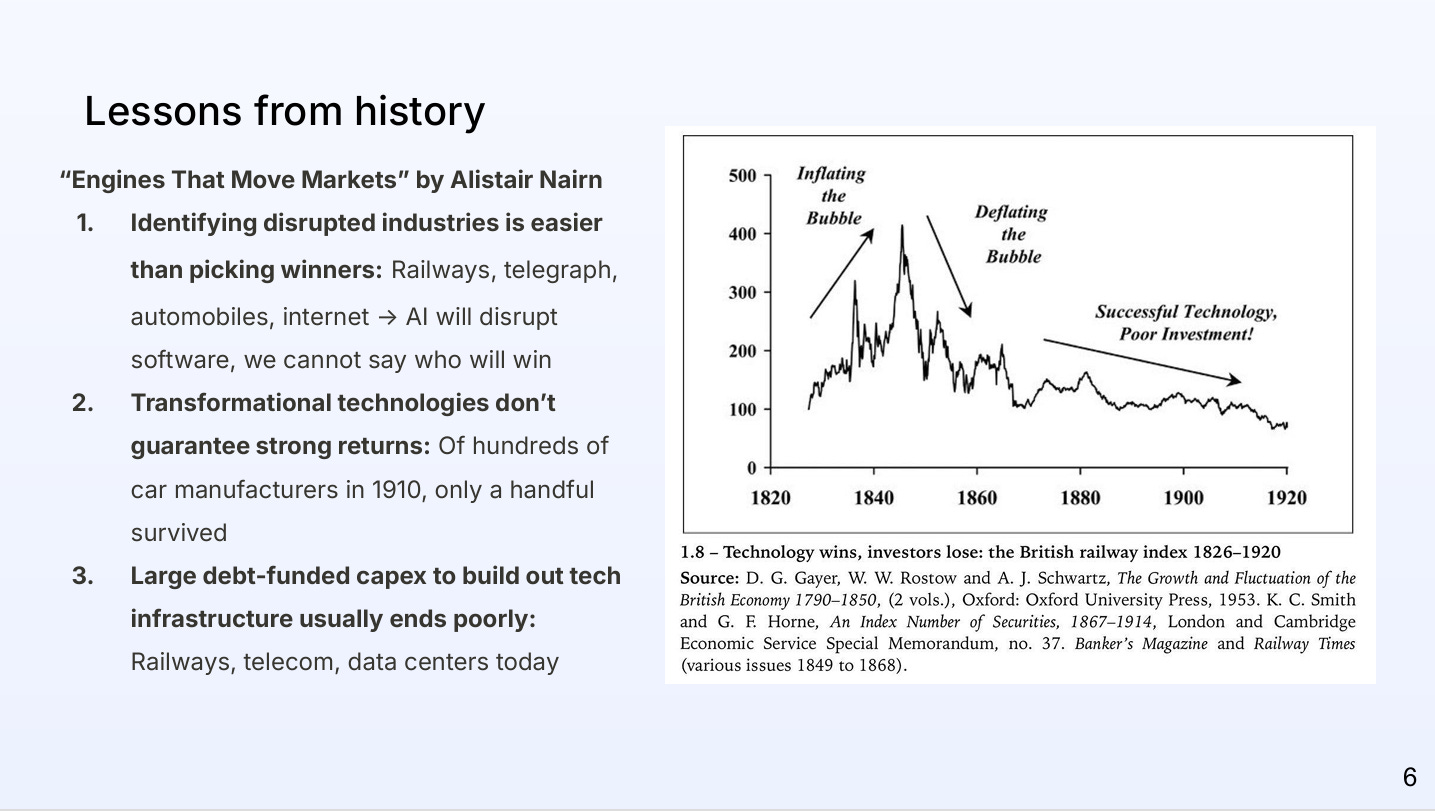
Of hundreds of car manufacturers in 1910, only a handful survived. The internet transformed commerce, media, and communication — and then the dot-com bubble wiped out 80% of equity value in eighteen months. The early leaders in almost every technology cycle failed or were acquired. Competitors disappeared. The market was right about the technology and wrong about the winners.
The implication for credit is uncomfortable: “We can say with high confidence that AI will disrupt software. What we cannot say is which specific SaaS companies will efficiently integrate AI — and we also cannot say which will take the wrong steps and get wiped out.” The current selloff, in this framing, is the market repricing uncertainty rather than expressing a precise view on individual credits. It is that unknown — not a specific set of defaults — that is driving spread widening across the sector.
The data centre parallel is particularly salient. In 2026, hyperscalers are expected to spend approximately $750 billion in annual capex. The most recent HY data centre bond — for Fleet Data Centers, a subsidiary of Trapped Capital — is a 200-megawatt initial build working toward a 25-gigawatt total capacity. Many of these deals are underwritten at 80–100% utilisation. The historical precedents — the railway mania of the 1840s, the $1 trillion fibre buildout of the telecom bubble that peaked at single-digit utilisation — are not reassuring.
Is AI Replacing the Software TAM or Growing It?
The question of whether AI substitutes for existing software spend or expands the addressable market is the right one to ask — and the answer is that three things are happening simultaneously, with the net effect still unresolved.
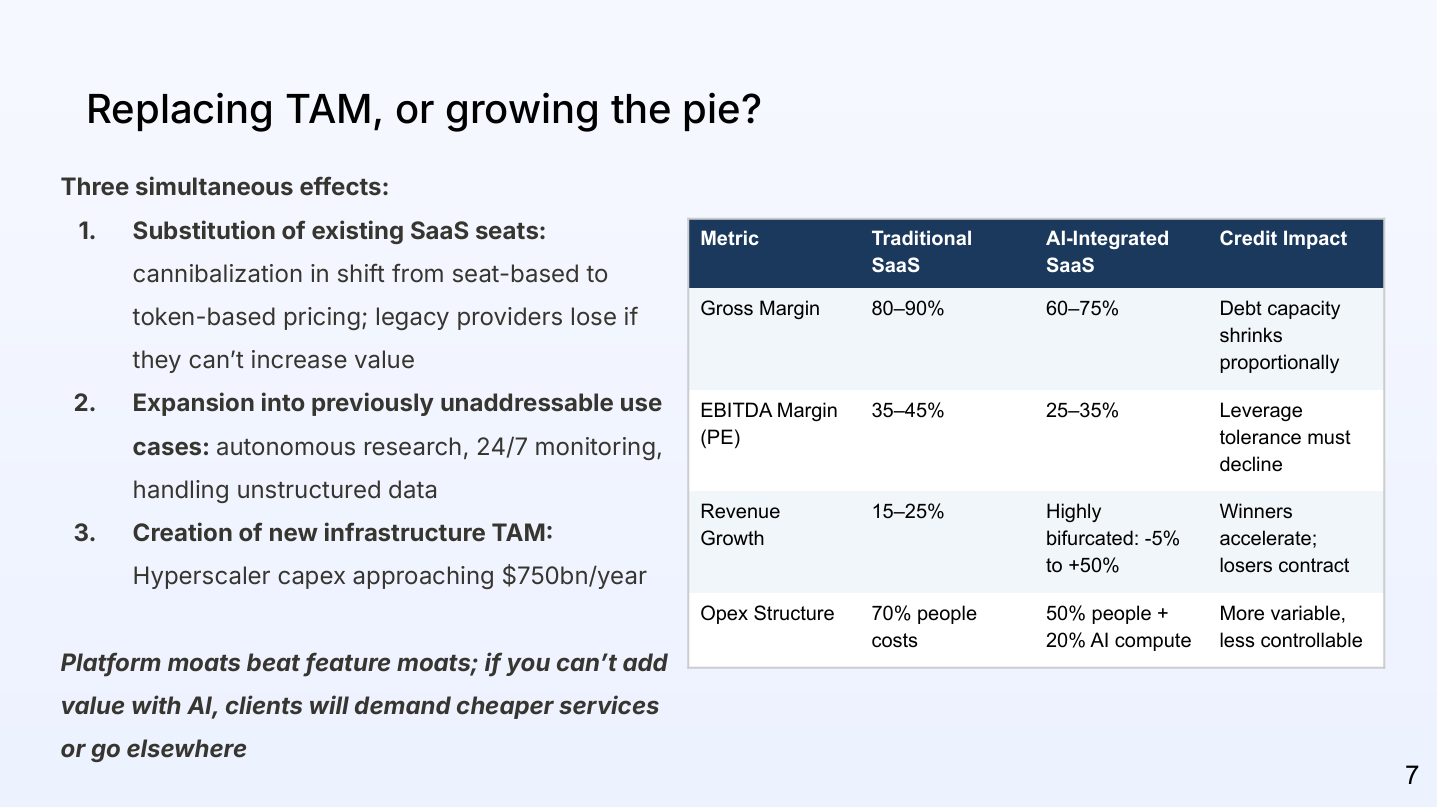
The first dynamic is substitution: AI agents replace human seats, which represents direct revenue loss for incumbent SaaS vendors. One AI agent replacing multiple human users is straightforward revenue cannibalization for a per-seat pricing model. The second dynamic is expansion into previously unaddressable use cases — autonomous research, 24/7 monitoring, handling unstructured data — which grows the total addressable market. The third dynamic is creation of entirely new infrastructure demand: hyperscaler capex approaching $750 billion annually is additive to existing enterprise software spending.
The credit implication of the first dynamic is the most immediate and most negative: seat-based pricing is structurally challenged. A consumption-based model (cost per token, cost per API call, cost per workflow completed) introduces revenue volatility that credit models have not historically been built to handle. The SaaS ARR metric — the heartbeat number that lenders underwrite against — becomes unreliable as a forward indicator when revenue is variable rather than contracted. Some companies are moving toward hybrid models: a base contract with usage overcharges, capturing both predictability and upside from power users. Twilio is the cited example of a European HY credit already operating on a usage-based model — and while that was flagged as a potential risk 12 months ago, it may now represent a structural advantage in an AI-driven world.
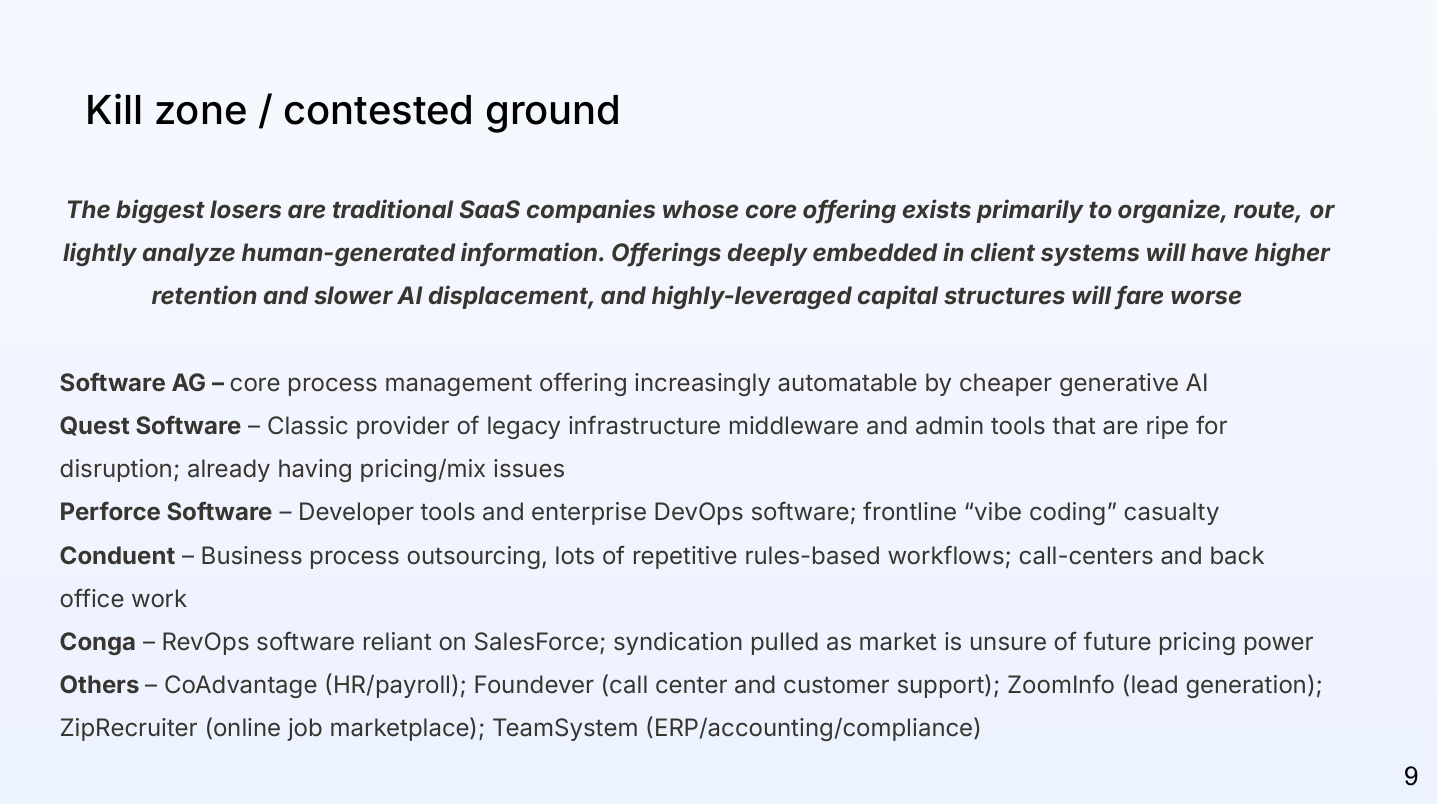
Platform moats beat feature moats in this environment. A feature moat — a smart search, a workflow automation, a nice dashboard — can be replicated by a capable developer in days. A platform moat — owning the system of record, the data flows, the integration layer — cannot be replicated without ripping out the plumbing that a business depends on. Conga, a Thoma Bravo-backed RevOps company built on top of Salesforce, is the cited example: its financing was pulled mid-sell-off because the market could not price the value of a feature moat on top of a platform whose equity had already repriced.
The Disruption Framework: A Credit Matrix for Every SaaS Name
The analytical tool that Alec and Matthew presented is a 2×2 framework mapping two axes: data moat depth (how much proprietary, irreplaceable data does the company control?) and workflow complexity (how structured, regulated, and judgment-intensive are the tasks the software automates?). It was pioneered here:

The four quadrants define four distinct credit risk profiles.
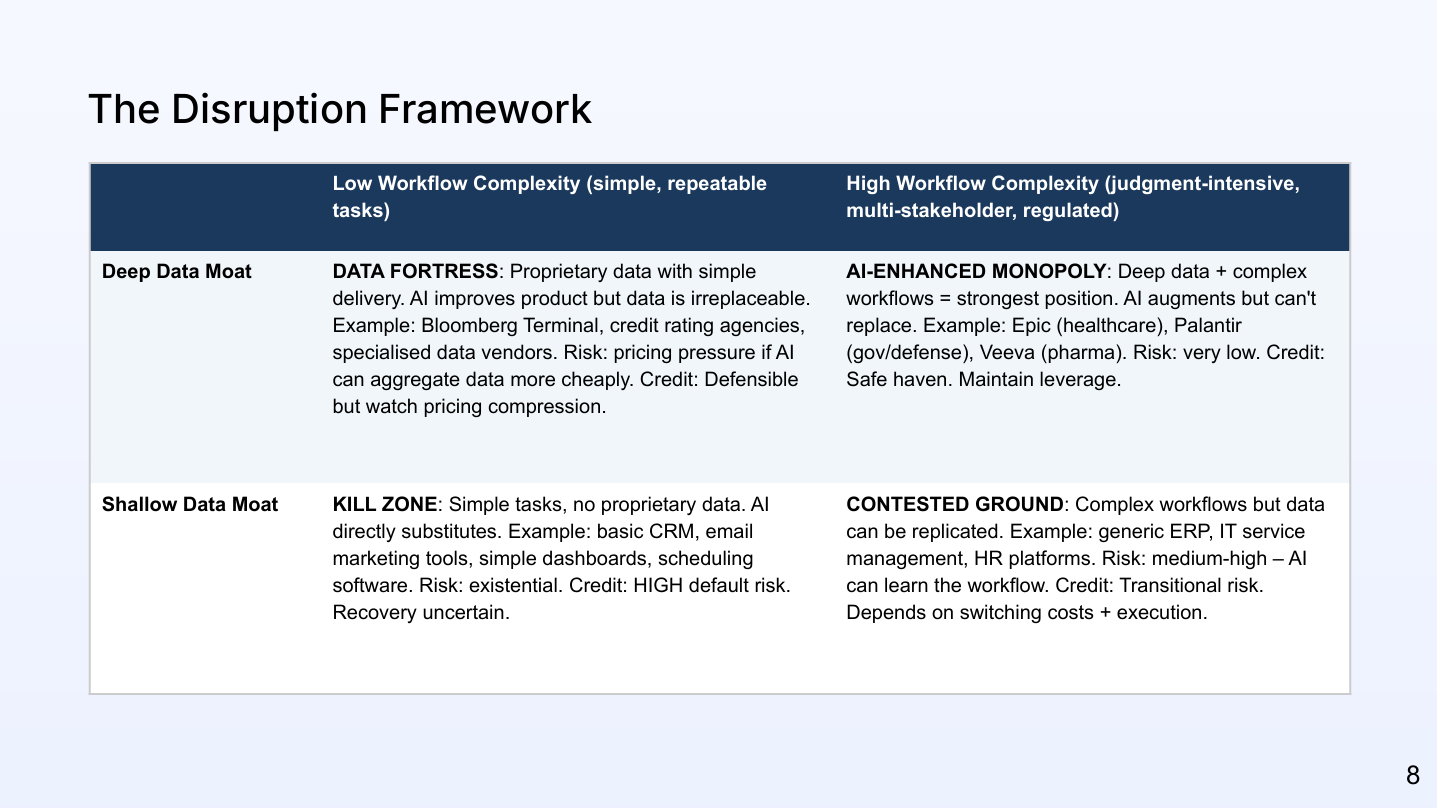
Kill Zone (shallow data moat, low workflow complexity): Simple, repeatable tasks with no proprietary data advantage. AI directly substitutes. Examples include basic CRM tools, email marketing platforms, simple dashboards, scheduling software. The credit risk is existential. Recovery value is uncertain because the intangible assets that constitute the value of these businesses — a code base actively maintained by engineers who have better options elsewhere — are subject to the doom loop described earlier. Alec’s framing: “Over the next 12–18 months, we may see a lot of these entering distressed territory and finding out how valuable their IP really is.”
Data Fortress (deep data moat, low workflow complexity): Proprietary data with simple delivery. AI improves the product but cannot replicate the data. Examples include Bloomberg Terminal, credit rating agencies, and specialised data vendors. These are defensible credits — but pricing pressure exists if AI can aggregate comparable data more cheaply. If a generic model can produce output that is 80–90% as accurate as the proprietary product, that shifts pricing power toward the client. The real opportunity for Data Fortress companies is to leverage their proprietary data to build AI-powered workflows and extend their moat rather than simply defend it.
Contested Ground (shallow data moat, high workflow complexity): Complex workflows that are not easily replaced because of scale and interconnectivity, but data advantages are limited. Generic ERP, IT service management, and HR platforms sit here. These are not the easiest businesses to displace — ripping out enterprise resource management is a multi-year project with substantial migration cost — but the switching cost is not data-driven, which means motivated enterprises can eventually make the move. The credit opportunity here is that some of these names have been oversold in the current repricing and may offer value relative to the near-term disruption timeline.
AI-Enhanced Monopoly (deep data moat, high workflow complexity): The strongest position in software. Deep proprietary data combined with judgment-intensive, regulated, multi-stakeholder workflows that AI augments but cannot replace. Epic in healthcare, Palantir in government and defence, Veeva in pharmaceuticals. The risk here is low. These businesses are likely net beneficiaries of AI — layering AI onto an existing platform extends the moat rather than eroding it.
Proprietary data, in this framework, is the last line of defence for software valuations. Models are commoditising: open-source alternatives like Llama, Mistral, and DeepSeek are now frontier-capable, and 80% of AI startups reportedly use cost-effective Chinese models. The model layer itself is structurally a low-margin business. What cannot be commoditised is domain-specific training data accumulated over decades — health records, financial transaction histories, supply chain data. As Alec noted: “If you are simply a software company layering a pretty UI over somebody else’s data, somebody else can put a prettier UI over you. The data is the moat.”
Named Credits: Kill Zone and Contested Ground
The conversation covered a range of specific names across both the risk and opportunity ends of the framework.
European names
ION Platform sits in the AI-Enhanced Monopoly quadrant on the framework. It serves large-scale enterprise contracts with asset managers, banks, and trading firms — subscription terms averaging five years and a reported 2.8x weighted-average contract term remaining. Deeply embedded workflows requiring compliance, risk management, and data sovereignty make churn risk low and switching cost high. The credit thesis is that AI gets layered on top of the platform rather than replacing it.
The complication is market mechanics rather than business fundamentals: ION Platform has been one of the worst performers in European HY in 2025, in part due to opacity in its financials and investor concern — perhaps not entirely rational — about the Altice precedent. In a market where creditors are watching for aggressive liability management, one of Europe’s most leveraged software capital structures attracts a risk premium regardless of operational quality.
TeamSystem — Italian SME-focused accounting, payroll, and compliance software — sits in Contested Ground. Deeply embedded in client filings, payroll runs, and regulatory workflows, it benefits from inherent retention. Full displacement by an AI agent in the near term is unlikely. The market has treated it more gently than ION Platform, reflecting the difference between contested ground (showing-me stage, limited AI substitute) and a deeply leveraged monopoly with opaque financials.
Software AG sits in or near the Kill Zone. Its core process management offering — documentation, workflow mapping — is increasingly automatable by cheap generative AI tools, particularly for SME clients looking for cost reduction. Buyers are expecting AI features as table stakes, not as a value-add. The spend required to add those features will pressure margins, and NRR is at risk as customers find cheaper alternatives.
US names
The US market context is important: private credit is substantially larger in the US than Europe, and BDCs like Blue Owl Technology Finance and Sixth Street Specialty Lending have more than 50% exposure to software names. The most recent development — a separate Blue Owl fund permanently restricting withdrawals — underscores that the repricing is not just a public market phenomenon.
Conduent is the clearest Kill Zone name in the US conversation. Business process outsourcing — call centres, repetitive back-office workflows, rules-based tasks — is precisely what AI agents are best suited to automate. Conduent has no proprietary data moat. Its service delivery is commoditised. Despite being lower-levered than many software LBO names, its secured notes fell 20 points in a month — demonstrating that you do not need an over-leveraged capital structure to be in the crosshairs of an existential business model shift.
Quest Software sits close to the Kill Zone boundary — legacy infrastructure middleware and admin tools with limited proprietary data advantage. AI-native tools can increasingly replicate administration, monitoring, and troubleshooting. Quest was already experiencing pricing and mix pressure before the AI acceleration. A refinancing in mid-2025 preserved it through the near term, but if AI erodes the need for standalone admin tooling, margin durability is materially weakened.
Perforce Software — developer tools and enterprise DevOps — sits in the AI blast radius most directly. AI coding assistants reduce reliance on traditional version control, testing, and DevOps orchestration. Perforce is B3 rated, sponsor-backed, and 5x levered. The combination of leverage and frontline AI exposure is the most dangerous combination the framework identifies.
On the other side: Cloud Software Group is cited as a genuine software credit that can adapt — primarily because of scale. As the largest privately owned software company, it has the resources to invest in AI integration that smaller, more concentrated players do not. Qlik Technologies (BI platform) is named as a double-B-rated first-lien credit that has sold off but where lenders remain constructive — a name swept up in headline risk that operates in industries with significant near-term inertia.
Winners: Picks and Shovels, Infrastructure, and Good Credits Sold Off Hard
The real winners of this transition, as Alec framed it, are not software companies. They are the businesses providing the physical infrastructure that AI runs on — regardless of which AI model, which application layer, or which software company ultimately survives.
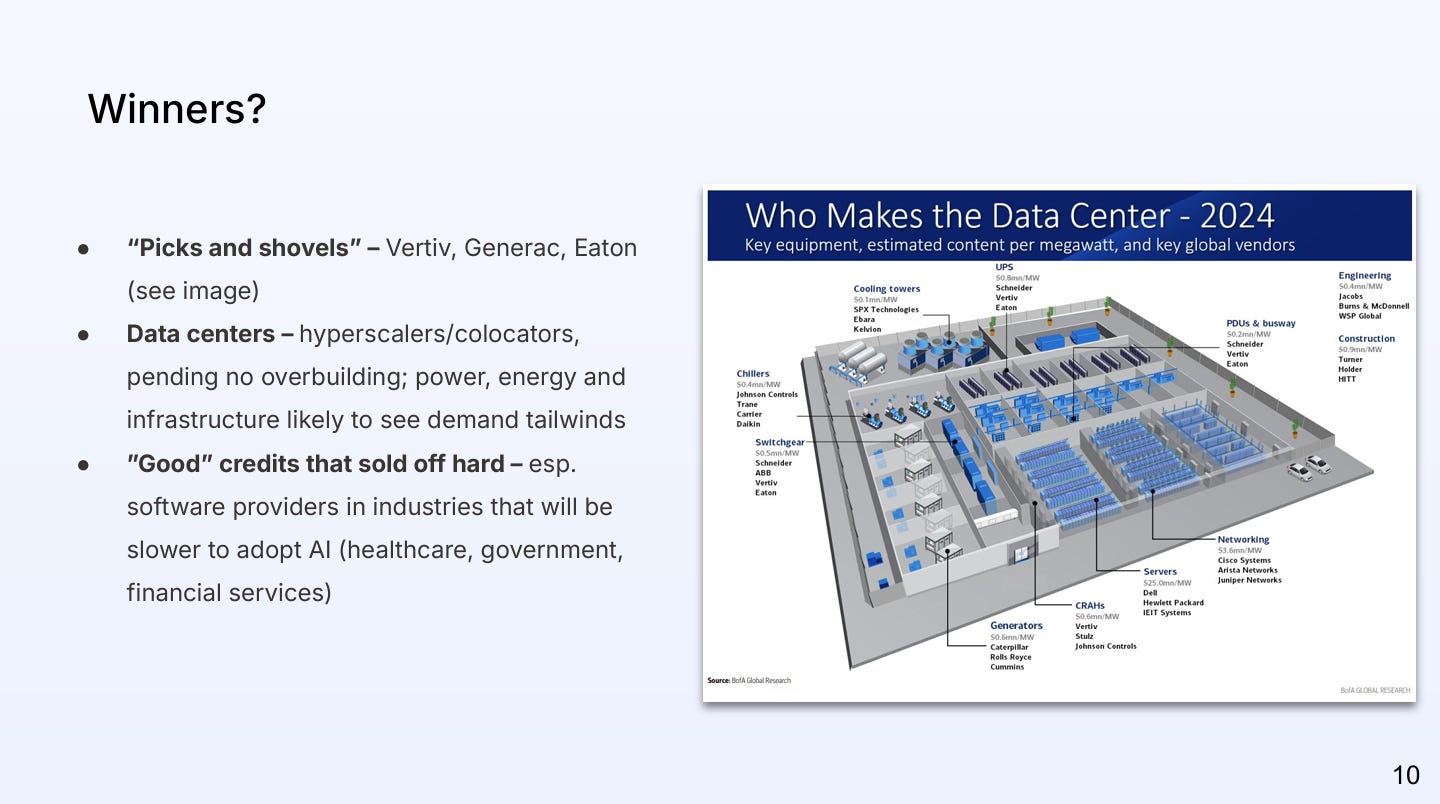
Vertiv, Generac, and Eaton are the cited picks-and-shovels plays. Vertiv and Eaton supply power distribution, cooling, and UPS systems to data centres. The demand tailwind from AI is structural and does not depend on any individual hyperscaler or AI model winning the market. Historical demand for electrical equipment at data centres is being overwhelmed by AI-driven requirements — companies like Vertiv have already reported significant gains.
The data centre credit story is more complicated. $15 billion of HY data centre debt has been issued since October 2024, almost all of it structured as project finance — pre-revenue builds underwritten at 80–100% utilisation. The construction risk, energy infrastructure constraints, and counterparty concentration (many deals dependent on a small number of hyperscaler tenants) are real risks. The Fleet Data Centers offering is illustrative: a 200-megawatt initial facility working toward 25 gigawatts of total capacity, from a company without a substantial operating track record. The telecom parallel — a $1 trillion fibre buildout at single-digit utilisation — is not alarmist framing; it is the historical base rate for technology infrastructure build-outs funded by capital markets.
Healthcare software companies represent the most interesting near-term opportunity in the “good credit sold off hard” category. Healthcare in the US operates with significant regulatory inertia — slower AI adoption than financial services or technology — which gives companies like R1 RCM, Ensemble Health Partners, and Meddata a meaningful runway before their addressable market shrinks. In the near term, they can slash labour costs as AI tools come online while their hospital and payer customers have not yet adopted AI themselves. The asterisk: on a long enough horizon, as hospitals and payers adopt AI, the TAM for these intermediaries shrinks materially. The credit opportunity is timing — buying at distressed levels during a market sell-off when the headline risk is AI disruption but the near-term cash flow is protected by industry inertia.
Khaki International — defence IT services contractor for the US Department of Defense — is a name mentioned specifically: the DoD’s announcement of a shift toward software-based infrastructure creates a direct revenue tailwind regardless of which AI model ultimately prevails inside that infrastructure.
The Analyst Handbook: How to Screen Any SaaS Credit Now
Matthew offered a practitioner’s checklist at the close of the conversation — four screening questions and five key credit risks for any SaaS name in a post-AI market.
The four screening questions are:
Revenue durability: What is the NRR? What is gross revenue retention? Are contracts enterprise-level or SME? How will those clients respond to the AI disruption in their own industry?
Cash timing: Is the company extending payment terms — allowing monthly rather than annual billing — to retain clients who might otherwise churn? This is a leading indicator of ARR stress before it hits revenue.
Profitability: Rule of 40 (EBITDA margin + revenue growth rate), current EBITDA margins and gross margins, trend direction.
Leverage tolerance: What happens to covenant headroom if EBITDA margins compress 500bps? If revenue growth drops from 15% to 5%? Build the scenario table — the non-linearity makes it essential.
The five key credit risks to flag for every SaaS name:
Concentration risk: How many customers account for 20%+ of ARR? Single-customer concentration is catastrophic in a churn scenario.
Pricing model transition: Is the company on seat-based, usage-based, or hybrid pricing? How dependent is the current ARR on a per-seat model that AI agents directly threaten?
Cybersecurity exposure: AI-powered attacks on software systems are a growing risk. Third-party breaches that affect a SaaS platform’s data integrity can drive accelerated customer churn.
Third-party dependency: What happens if a core infrastructure dependency (a hyperscaler, a key API provider) goes down? What is the recovery plan?
Ownership structure: Founder-led and focused on long-term growth versus PE-owned and optimising for exit. The PE playbook has historically compressed R&D and S&M investment — which is the exact investment the business needs to make right now to defend against AI disruption.
Listen to the full episode for Alec’s and Matthew’s takes on BDCs.
This article is based on Episode 8 of Fixed + Floating, featuring Alec Keblish and Matthew Hughes of 9fin. The views expressed are those of the speakers and do not constitute investment advice. For more information, please visit 9fin.com.
Fixed + Floating is a credit podcast for institutional investors and finance professionals — exploring the forces shaping global credit markets. Hosted by credit PM Josef Pschorn, the show features conversations with leading voices from investing, research, and academia.
Support Material: